Basic Statistics
Mean or Average
The mean or average of a set of values is the sum of the values divided by the number of the values. Symbolically,
\[ \overline{x} = \frac{1}{N} \sum_{i=1}^{N} x_i \]The mean of a number of repeated measurements of an experimental quantity is the best estimate of the true value of the quantity.
Standard Deviation
Besides a good guess for the true value, we need a way of quantifying how confident in that value we should be. We will use the mean for that guess, but we will have to work a bit harder to estimate the confidence. The first step is to look for an answer to the question, Roughly how far away from the true value is the next measurement apt to be? A good way to estimate this distance is with the standard deviation.
The standard deviation of a set of values is a measure of the typical distance between the average \( (\overline{x}) \) and any given value. It measures the “width” of the distribution of values, as shown in the figure, which has a mean of 3 and a standard deviation of 1.
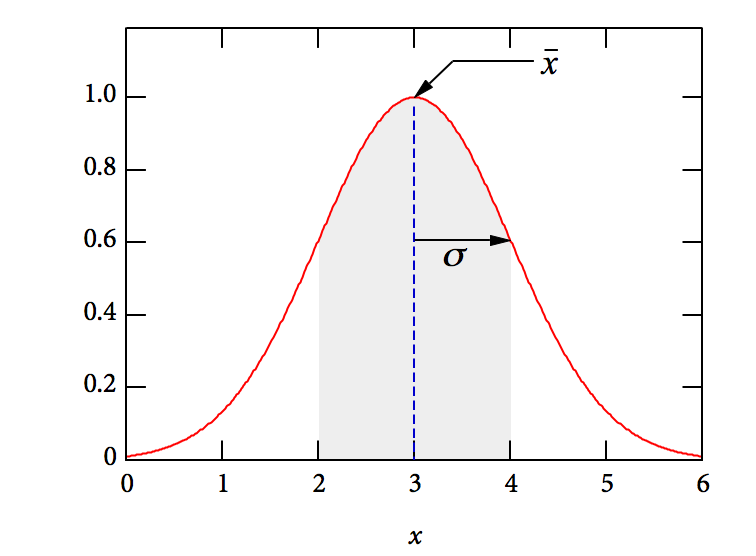
Imagine plotting a histogram of the horizontal distance \( x \) traveled by a projectile launched from a (rather shoddy) spring-loaded launcher. If the projectile is launched a great many times, the distribution of \( x \) (in meters) might look like that shown in the figure. The shaded region shows the measurements that are within one standard deviation of the mean. This comprises about 68% of the measured values (68% of the total area under the red curve).
The (sample) standard deviation is defined by \[ \sigma_x = \left[ \frac{\sum_{i=1}^{N} \left(x_i - \overline{x} \right)^2}{N-1} \right]^{1/2} \] which looks like a mess, but is really not too hard to understand. Working from inside out, we see that the numerator is of the sum of the square of the “distance” of each point \( x_i \) from the mean \( \overline{x} \). Each of those terms is non-negative, so the sum is greater than or equal to zero. To get the average square you’d think we should divide by \( N \), but it turns out that the right factor for the denominator is \( (N-1) \), because we usually don’t know the mean of the distribution a priori, and so we use the average of our sample to estimate it. (See An Introduction to Error Analysis, Second Edition, by John R. Taylor, p. 100, for a simple discussion, and Appendix E for a more thorough discussion.) Finally, we take the square root of the average square deviation to get the “typical” deviation, since we were adding up the squares of the deviations in the numerator.
Standard Error
When you perform repeated trials of an experiment to obtain the best possible estimate of the value of a physical quantity, as described above, you virtually never obtain the “exact right answer.” Imagine making several launches of the projectile, whose distribution function is shown in the figure above. On each measurement, you have about a 68% chance of obtaining a measurement in the gray region, within one \( \sigma_x \) of the mean. If you make a number of measurements and average them, though, you will obtain average values that cluster ever closer to the true mean as you increase the number of measurements that you average. The more you measure, the better your estimate of the true value.
Unfortunately, the rate at which you improve the measurement gets slower and slower with increasing values of \( N \). The distribution of \( N \)-sample averages narrows around the true mean, and has a width called the standard error or the standard deviation of the mean (SDOM, for short). It is given by
\[ \text{SDOM} = \sigma_{\,\overline{x}} = \frac{\sigma_x}{\sqrt{N}} \]The standard error is usually the best way to characterize the uncertainty in the average you compute from making \( N \) measurements of the same quantity. So, we typically take the uncertainty to be the standard error:
\[ \delta x \equiv \sigma_{\,\overline{x}} \]Summary
- The standard deviation quantifies how far away from the mean the next measurement is apt to be. It is the single-measurement uncertainty.
- The standard error quantifies how far away from the true value the average of \( N \) measurements is apt to be. It is the \( N \)-measurement uncertainty.